How to Calculate Average Order Value: Simple Guide to Boost Revenue
Dec 17, 2025
|
Published

Alright, let's talk about Average Order Value, or AOV. You’ve probably seen this metric floating around your dashboard, but what is it, really?
At its core, the calculation is simple: you take your total revenue from a specific period and divide it by the number of orders you received. But don't let that simplicity fool you. This single number tells a powerful story about your customers' buying habits and the financial health of your store.
What Is Average Order Value and Why It Matters

Think of AOV as a direct line into how much value each customer transaction brings to your business. It's a critical pulse check.
Many store owners get stuck on the treadmill of customer acquisition, pouring money into ads to get new people in the door. That's an expensive game to play. Focusing on increasing your AOV is about getting more value from the traffic you already have. A higher AOV means better profitability and a far more sustainable path to growth by focusing on customer lifetime value.
For a quick reference on what goes into this calculation, here's a simple breakdown.
AOV Calculation At a Glance
Component | Description | Example Value |
|---|---|---|
Total Revenue | The total income generated from sales over a defined period. | $50,000 |
Total Orders | The total number of unique transactions completed in that period. | 500 |
AOV Formula | Total Revenue ÷ Total Orders | $50,000 ÷ 500 = $100 |
As you can see, the math itself is straightforward. The real magic is in understanding what to do with that number once you have it.
The True Power of Boosting Your AOV
Improving your AOV isn't about pushing customers to spend more than they want to. It's about making their shopping experience better so they naturally add more to their cart. This is a common stumbling block for merchants who immediately jump to aggressive discounts, which just eats away at their margins and attracts one-time bargain hunters.
A much better way forward is to offer incentives that genuinely add value. Think about rewards that feel like a win for the customer and encourage bigger purchases without sacrificing your profit:
Free gifts that unlock once they hit a certain cart value.
Complimentary shipping that nudges them to add just one more item.
Tiered rewards that build a bit of fun and excitement as their cart size grows.
The goal is to shift your mindset from short-term sales to long-term value. A customer who receives a surprise free gift with their order is far more likely to come back and shop again than one who just used a hefty discount code and disappeared. This focus on rewards builds a healthier customer lifetime value.
AOV in Today's Ecommerce World
Keeping a close eye on your AOV is more important now than ever before. With customer acquisition costs constantly on the rise, getting more value from every single order is essential.
We've seen a pretty big shift in this metric recently. Back in 2019, the worldwide AOV was hovering around $111. Fast forward to 2024, and that number has climbed to $144. This 30% increase tells a story of inflation, sure, but also of smarter ecommerce strategies—like bundling and strategic upselling—that successfully push customers past free shipping thresholds. You can dig into more of these ecommerce benchmarks on SpeedCommerce.
By focusing on tactics that increase the value of each transaction, you’re building a much more resilient business. This is where tools like Monster Cart can be a game-changer, letting you weave rewards and upsells directly into the cart experience. It makes encouraging higher spending feel natural and rewarding, which is key to improving both AOV and that all-important customer lifetime value.
Finding the Numbers You Need to Calculate AOV
The AOV formula itself is simple, but the calculation is only as good as the data you plug into it. Getting your hands on accurate Total Revenue and Number of Orders is where the real work begins. Thankfully, the platforms you already use every day make this pretty painless once you know where to click.
For most ecommerce stores, your platform's built-in analytics are the fastest route. If you're on a platform like Shopify, you can skip the hassle of exporting CSVs and digging through spreadsheets. The numbers are right there in your admin dashboard.
Pulling Your Data from Shopify
If you're a Shopify merchant, you're in luck. Finding your core sales data is incredibly straightforward. Just head over to the Analytics section in your admin panel. While the main dashboard gives you a quick overview, the real gold is in the Reports section.
Here, you can pull up all sorts of sales reports and filter them for any time frame you need—last month, last quarter, or even a custom date range for a specific promotion. It's perfect for a quick health check or a much deeper analysis of your store's performance.
This screenshot of a Shopify 'Sales by channel' report shows you exactly where to find net sales (your revenue) and total orders.
As you can see, the two numbers you need for the AOV formula are right there, side-by-side. This makes it incredibly easy to see how different channels are performing at a glance.
Finding AOV Data in Google Analytics 4
Many brands use Google Analytics 4 (GA4) for a more complete picture of website performance, and you can absolutely find your AOV data there, too. The interface is a bit different from Shopify's, but the key metrics are all accounted for.
Here’s the path to your ecommerce data in GA4:
First, navigate to the Reports section.
From the 'Life cycle' dropdown menu, choose Monetization.
Then, click on Ecommerce purchases.
This report will show your Total revenue and the number of transactions, which is GA4's equivalent of your Number of Orders. Just be sure to set the date range in the top right corner to isolate the period you want to analyze. This gives you the power to see how your AOV trends over time, especially after launching a new marketing campaign or making changes to your site.
Don't just calculate your AOV once and file it away. Get in the habit of checking this metric weekly or monthly. It’s the only way to know if the strategies you’re trying—like adding a free gift or shipping threshold with a tool like Monster Cart—are actually paying off.
When you track this data consistently, you establish a baseline. That baseline becomes your single source of truth for measuring the impact of every little change you make. Whether you're testing new product bundles or tweaking your upsell offers, you need solid data to prove what's moving the needle. It helps you shift from chasing one-off, discount-driven sales to building real, sustainable customer lifetime value over the long haul.
Using AOV Segmentation to Uncover Hidden Opportunities
Calculating a single, store-wide Average Order Value is a decent start, but honestly, it only scratches the surface. That one number mashes all your customers together, hiding the most interesting parts of the story. The real magic happens when you start segmenting your AOV data. This is how you transform a simple metric into a powerful diagnostic tool for your store.
When you break down AOV, you can pinpoint exactly who your most valuable customers are and what makes them tick. This approach helps you find those hidden pockets of opportunity and spot potential problems before they grow.
This visual breaks down the simple but powerful formula at the heart of AOV calculation.
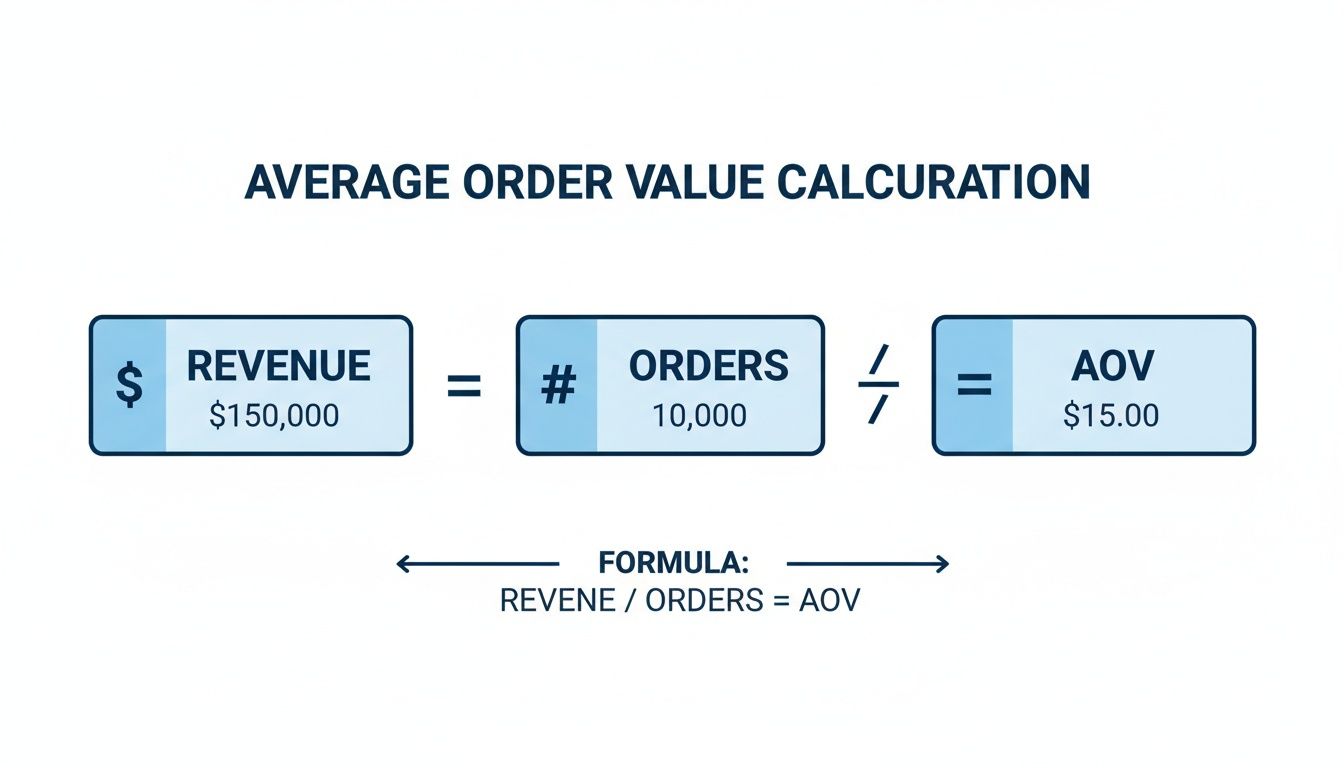
While the formula is universal, the results you'll uncover through segmentation will be completely unique to your business.
Where to Start With AOV Segmentation
Segmentation is all about comparing the spending habits of different customer groups. Instead of looking at one blended average that doesn't really mean much, you can calculate AOV for specific cohorts to get a much clearer, more actionable picture.
Not sure where to begin? Here are a few essential segments I always recommend analyzing:
New vs. Returning Customers: Are new shoppers spending more or less on their first purchase compared to your loyal fans? A lower AOV for new customers is pretty common, but a huge gap might mean your welcome offers are too aggressive or you're missing a chance to upsell them from the get-go.
Traffic Source: Do customers coming from organic search have a higher AOV than those clicking through from paid social ads? Answering this helps you pour your marketing budget into the channels that actually attract high-value shoppers.
Device Type: Is there a noticeable difference in AOV between desktop and mobile users? If your mobile AOV is lagging, it could be a red flag for friction in your mobile checkout process, making it a pain for shoppers to add more items to their cart.
To put your numbers in context, it helps to look at industry benchmarks. For instance, the average order in the Americas is $181, which is quite a bit higher than EMEA at $130. You also see massive differences by product type—luxury goods can have an AOV as high as $417, while beauty products often hover around $71 because people buy them more frequently in smaller amounts.
Sample AOV Segmentation Analysis
Let's look at a fictional example to see how this works in practice. A quick table like this can make the insights jump right off the page.
Segment | AOV | Potential Action |
|---|---|---|
New Customers | $45 | Launch a tiered welcome offer (e.g., "Spend $60, Get a Free Gift") to encourage larger first purchases. |
Returning Customers | $82 | Focus loyalty program rewards on value-adds like free gifts over simple discounts to maintain high AOV. |
Instagram Ads Traffic | $38 | Test different ad creative or landing pages to better showcase product bundles and higher-ticket items. |
Email Marketing Traffic | $95 | Double down on email campaigns promoting bundles and high-value products to your most engaged audience. |
This kind of analysis immediately shows you where to focus your energy. It’s clear that email marketing is driving high-value orders while Instagram ads need some strategic adjustments.
Turning Insights Into Action
Once you have this segmented data, you can start making much smarter decisions. Let's say you discover that returning customers who receive a free gift with purchase have a 25% higher AOV than those who just use a hefty discount code. That’s a game-changing insight.
This data is telling you to lean into value-added incentives rather than margin-killing discounts. It's a clear signal to prioritize strategies that build customer lifetime value and encourage repeat business from happy, loyal shoppers.
Instead of running yet another 20% off sale, you could implement a tiered rewards system with an app like Monster Cart. This lets you set up in-cart goals where customers unlock a free gift once their order hits a certain threshold—nudging them to add just one more item in a way that feels like a win.
If you really want to dig in and tailor your strategies, running a more formal Customer Segmentation Analysis in Excel can give you the detailed framework you need to find even more opportunities.
Smart Strategies to Increase Your Average Order Value

Alright, you’ve got your AOV number. Now for the fun part—making it grow.
The go-to reaction for many store owners is to just throw hefty discount codes at everyone. I get it, it's easy. But that approach can quickly become a race to the bottom that demolishes your profit margins. A much smarter play is to focus on strategies that add genuine value to the shopping experience, nudging customers to spend more because they want to, not just because you’ve temporarily slashed prices.
This is a mindset shift. You stop chasing one-off sales and start building real customer relationships and a much healthier lifetime value. When you offer rewards like free gifts, complimentary shipping, or exclusive product bundles, you make customers feel like they're getting a great deal and create a shopping journey worth remembering. It’s all about enhancing their experience, not cheapening your products.
Set a Motivating Free Shipping Threshold
Let’s start with a classic for a reason: free shipping. It's one of the most powerful psychological levers you can pull. Customers will often happily add one more item to their cart just to avoid paying for delivery, which can give your order value a serious lift.
The key is setting a threshold that feels achievable, not out of reach.
A solid rule of thumb I’ve seen work time and again is to set your free shipping minimum about 30% higher than your current AOV. So, if most customers are spending around $50, offering free shipping at $65 gives them a clear, attainable goal. It works because it feels like a fair trade—they get a real benefit for spending just a little more with your brand.
Of course, to really boost revenue, you need to think bigger than just one tactic. It’s worth exploring a comprehensive proven growth plan for increasing Amazon sales to see how different strategies can work together to create momentum.
Create Irresistible Product Bundles
Product bundling is a fantastic way to introduce customers to more of your catalog while making them feel like they're getting a bargain. Instead of selling one item at a time, you package complementary products together and offer them at a price that’s slightly better than buying each one individually.
This tactic not only makes the decision-making process easier for the shopper but also naturally inflates the cart size. A skincare brand, for example, could bundle a cleanser, toner, and moisturizer into a "Complete Morning Routine" kit. This solves a customer’s problem and boosts your AOV in one elegant move.
By focusing on value-adds like bundles and free gifts, you're not just increasing AOV for a single transaction. You are actively building customer loyalty and encouraging repeat purchases, which is the foundation of sustainable growth and a healthy customer lifetime value.
Implement Tiered Rewards and In-Cart Upsells
This is where your shopping cart stops being a simple checkout page and becomes a powerful revenue engine. Forget the static summary of items. Your cart should be an interactive experience that actively encourages customers to hit that next spending tier. This is precisely where a tool like Monster Cart becomes a game-changer.
You can set up a tiered rewards system right inside the cart drawer. As a customer adds items, a progress bar fills up, visually showing them how close they are to unlocking the next reward.
Think of it like a mini-game:
Tier 1: Spend $50, unlock Free Shipping.
Tier 2: Spend $75, unlock a Free Gift.
Tier 3: Spend $100, unlock a 10% Discount.
This "gamified" approach makes shopping more engaging and clearly motivates customers to reach the next milestone. It’s a seamless way to upsell without annoying, disruptive pop-ups—a core principle of effective shopping cart optimization.
Recent Shopify data shows just how much potential is on the table here. While the global AOV hovers around $85-$92, the top 10% of merchants are averaging over $120. They get there using these exact strategies—smart bundling and motivational rewards that can lift AOV by over 50%.
Common Pitfalls to Avoid When Tracking AOV
Getting your data right is the foundation of every smart business decision you'll make. When you know how to calculate average order value the right way, you get an honest look at your store’s performance. But a few common slip-ups can easily throw off your numbers, sending you down the wrong path.
One of the most common mistakes I see is including shipping fees and taxes in the revenue calculation. I get it—it's part of the total a customer pays. But it's not money you actually pocket. Tossing those numbers in will artificially inflate your AOV, giving you a false sense of security about your profit margins.
You should always, always base your AOV on net revenue. That’s the money you get after discounts but before adding on shipping and taxes. This is the only way to get a true measure of what customers are actually spending on your products.
Inconsistent Tracking and Reporting
Another pitfall is spot-checking your AOV instead of tracking it consistently. Pulling the number once in a blue moon just isn't going to cut it. You’ll completely miss important trends and won't be able to see how your AOV changes in response to marketing campaigns, site updates, or new product drops.
To get any real value, you have to get into a rhythm. Whether you check it weekly, monthly, or quarterly, consistency is the key. A regular cadence allows you to:
Establish a solid baseline to measure all your efforts against.
Spot seasonal trends in customer spending habits.
Accurately gauge the impact of your new AOV-boosting strategies.
Without that consistency, you're flying blind. You could run a brilliant free gift campaign, but you’d have no hard data to prove it actually nudged your order values up.
Don’t get stuck in short-term thinking. Tracking AOV consistently helps you build long-term customer lifetime value instead of just chasing one-off, discount-fueled sales.
Comparing Your AOV to Irrelevant Benchmarks
It's so tempting to Google "good AOV for ecommerce" and hold yourself to the first number that pops up. But here's the thing: comparing your AOV for a niche apparel brand to a huge electronics retailer is like comparing apples to oranges. Industry benchmarks can offer some context, but only if they’re relevant to your specific market, product type, and audience.
Instead of obsessing over broad industry averages, focus on your own history. Your real goal should be to improve your own AOV, month after month. Celebrate your own progress! A 10% jump in your store's AOV is a massive win, no matter what other industries are doing.
This internal focus keeps your strategy grounded and centered on what actually resonates with your customers. It encourages you to find sustainable growth through value-adds like free gifts or shipping thresholds—the kind of thing tools like Monster Cart can help you set up in minutes.
Common Questions About Average Order Value
Once you start digging into your Average Order Value, you’ll probably find yourself asking some of the same questions every other store owner has. Getting these sorted out is what turns AOV from just another number on a dashboard into a powerful tool for growing your business.
Let's dive into the most common ones I hear.
How Often Should I Be Checking My AOV?
The most important thing is consistency, but you need a rhythm that actually tells you something useful. For most stores, calculating AOV on a monthly basis is the sweet spot. It's frequent enough to see how your marketing campaigns are performing and to catch trends early, but not so often that you're just reacting to daily fluctuations.
However, if you're running a big sale—like for Black Friday or a new product launch—switching to a weekly check-in is a smart move. This gives you almost real-time feedback on whether your strategies are working. The real goal is to get into a regular habit so you can build a clear baseline of your store’s performance over time.
What’s a “Good” Average Order Value, Anyway?
This is the question everyone asks, but the honest answer is… it completely depends on what you sell. A "good" AOV is all about context. For a high-end jewelry brand, an AOV over $300 might be standard. But for a store selling cosmetics, that number would be unheard of, as orders there usually land between $15 and $90.
The best benchmark is yourself. Stop worrying about industry averages and start focusing on improving your own AOV. The only comparison that truly matters is how you're doing this month versus last month, or this quarter versus last quarter.
When you shift your focus inward, you start building sustainable growth strategies that increase customer lifetime value, not just chase a vanity metric. A steady climb in your own AOV is the real indicator of a healthy business.
Can My AOV Go Down and It Still Be a Good Thing?
It sounds counterintuitive, but yes, absolutely. Sometimes a dip in AOV can be a fantastic sign for your business.
Picture this: you launch a brilliant ad campaign that drives a massive wave of first-time buyers to your site. These new customers are often a bit more hesitant. They’ll likely make a smaller initial purchase to try you out before committing to a bigger order.
This flood of smaller "test" orders will naturally pull your overall AOV down for a bit. But look at what you’ve gained: a whole new audience of potential long-term customers. Now you have a huge opportunity to nurture them with great follow-up emails and smart offers to increase their lifetime value. It's a textbook case of a short-term dip for a much bigger long-term win.
If you want to master turning those first-time buyers into repeat fans, our in-depth revenue optimization course covers the exact frameworks to make it happen.
The bottom line is that context is everything when you're looking at your AOV.
Ready to turn your cart into a revenue engine? With Monster Cart, you can easily implement tiered rewards, in-cart upsells, and free gift offers to boost your AOV without relying on margin-killing discounts. See why 7,000+ Shopify brands trust us to create a better cart experience. Get started with Monster Cart today
Join 7000+ brands using our apps


