How To Increase Conversion Rate Shopify With Effective Strategies
Dec 18, 2025
|
Published
Achieving a dependable Shopify conversion rate starts with a clear target: 2.5–3.0% is a solid baseline. When you lean into seamless cart flows, mobile-first tweaks, and compelling in-cart rewards—like free gifts, free shipping tiers, and targeted coupon codes—you’ll see stronger conversion and healthier margins. By focusing on boosting average order value (AOV) instead of heavy discounts, you also set the stage for higher customer lifetime value (CLV). Tools like Monster Cart make it easy to add real-time rewards without compromising UX.
Quick wins often come from removing friction and adding reward-based nudges. A few targeted shifts can make a big impact:
Spin-to-win popups that lifted pre-checkout conversions by 12% in one real-world test.
Sticky cart summaries reminding shoppers how close they are to free-shipping or free-gift tiers.
Checkout microcopy crafted to answer last-minute questions—boosting click-through by 0.8% overnight.
Tiered rewards and in-cart gamification that nudge AOV and encourage repeat purchases for higher lifetime value.
“One button copy tweak on the cart page alone drove a 0.8% lift in add-to-cart rates overnight,” says a Shopify merchant who’s seen first-hand results.
Open Shopify Analytics to pinpoint funnel drop-offs and prioritize reward experiments that drive AOV without eroding margins.
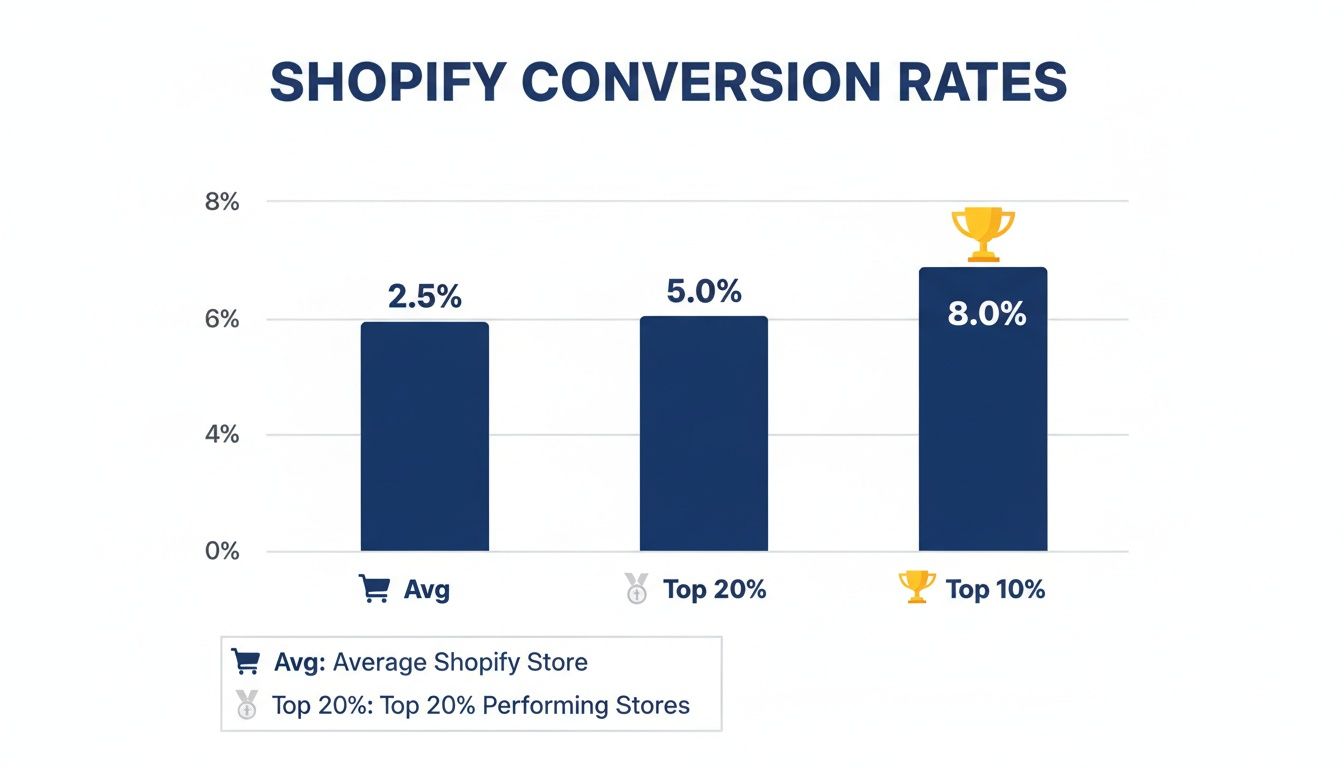
Shopify Conversion Rate Benchmarks
Below is a quick comparison of performance bands by overall, desktop and mobile rates—plus example verticals to guide your own targets.
Shopify Conversion Rate Benchmarks
Performance Band | Overall Rate | Desktop Rate | Mobile Rate | Example Verticals |
|---|---|---|---|---|
Average | 1.4% | 1.9% | 1.2% | General Stores |
Top 20% | 3.2% | 3.9% | 1.8% | Apparel, Health |
Top 10% | 4.7%+ | 5.0%+ | 2.5%+ | Beauty, Electronics |
Use these benchmarks to set realistic goals. If your current rate sits near the average, focus on reward-driven checkout flows—like adding a free-gift tier or free-shipping threshold—rather than blanket discounts.
Mapping device-specific targets, running rapid A/B tests on button colors, reward messaging, and shipping milestones can move you from average to elite. Keep your analytics dashboard open, track each tweak, and celebrate every percentage point gained.
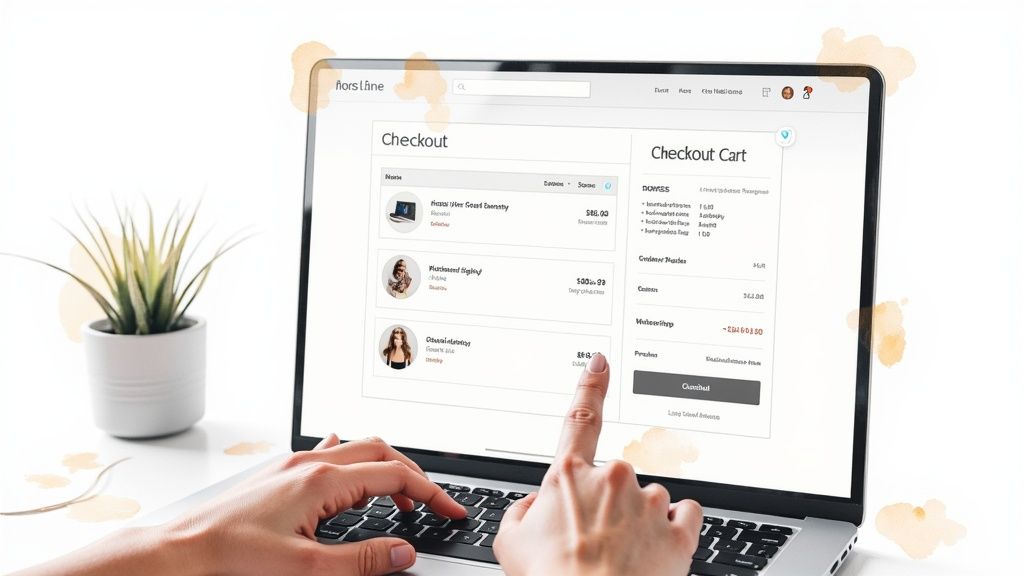
Improving Cart And Checkout Experience
A smooth cart flow can add a surprising bump to your completion rate. In one real-world test, tweaking just the design yielded an 18% lift in finalized purchases. Let’s unpack the features that keep buyers moving through the funnel without hiccups—and how you can layer in rewards to boost AOV.
Key Cart Flow Components
Persistent Cart Sidebar keeps the order summary in view as shoppers browse.
Progress Tracker (e.g., “Step 2 of 3”) eliminates uncertainty.
Guest Checkout lets first-timers skip account creation and jump straight to payment.
One-Click Address Lookup auto-fills forms, slashing typos and abandoned fields.
Offering guest checkout alone can cut drop-offs by a noticeable margin. Pair that with address auto-complete, and you’ve removed two of the biggest friction points. Then overlay a rewards banner—“Free shipping at $75”—to nudge spend higher.
Enhancing Shipping And Cost Transparency
Surprises at checkout are conversion killers. A quick shipping calculator in the cart preview sets clear expectations. Integrate dynamic widgets from carriers like UPS, DHL, or your chosen provider to boost credibility instantly.
Use microcopy to answer common concerns upfront:
“Taxes calculated at checkout”
“Free shipping on orders over $75”
You can also place concise reassurance snippets near CTAs:
Warranty coverage details under product titles
Trust badges beside the final button
Error messages that point to quick fixes
Rather than offering a sitewide 20% discount, highlight tiered shipping rewards—this raises AOV and preserves your margins.
“Displaying ‘Secure checkout with 128-bit SSL’ next to the Pay button reduced hesitation by 12%,” notes a CRO specialist.
A/B Testing To Fine-Tune Every Detail
Never assume your button label or reward prompt is perfect. A/B testing reveals what truly resonates:
Is “Complete Order” more compelling than “Pay Now”?
Do shoppers respond better to “Claim Free Gift” vs “Get 10% Off”?
Which shipping milestone phrase drives higher add-to-cart rates?
Run tests on comparable traffic segments, compare results, and deploy the clear winner for a measurable lift. Tools like Monster Cart let you swap in-cart reward messages without coding.
Customizing Themes For Better Accessibility
When mobile accounts for a large slice of traffic, theme choice matters. Clear focus states, generous touch targets, and proper color contrast can make or break the experience. Here’s how an advanced cart solution stacks up against a basic setup:
Feature | Default Cart | Monster Cart |
|---|---|---|
Persistent Drawer | ✗ | ✓ |
Real-Time Rewards | ✗ | ✓ |
Address Lookup | Basic | One-Click |
AOV Impact | Low | High |
Explore our Shopping Cart Optimization guide for deeper insights into theme tweaks, in-cart rewards, and customizations.
Adding In-Cart Rewards And Upsells
Transform your cart into a mini sales lab by weaving in rewards that spark extra purchases. These value-driven nudges do far more for your bottom line than an endless discount cycle. They not only boost AOV but also drive repeat visits for stronger lifetime value.
Offering a free gift at just the right milestone can bump your AOV significantly—one store saw a 14% lift by placing a gift trigger at the $80 mark.
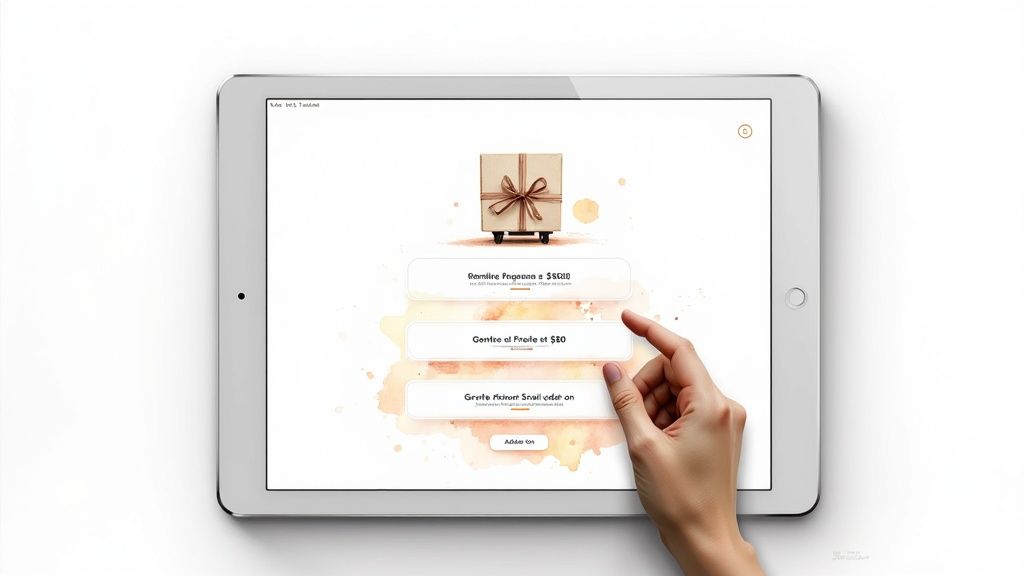
Setting Gift Thresholds
Clear spend milestones help shoppers understand exactly what they need to hit. A progress bar inside the cart drawer offers a real-time visual cue of how close they are to free shipping or a bonus item.
For instance, showing “Spend $50 more to unlock free shipping” right below the cart summary nudged one skincare brand’s AOV up by 8% in just a few weeks.
Here’s how you might structure your tiers:
$75 for free shipping with a dynamic progress bar
$100 to claim a complimentary branded mug
$150 to earn an exclusive sample pack
Those increments should align with your margins and reinforce repeat visits—turning one-off sales into ongoing relationships.
“Adding a visual tracker in our cart skyrocketed gift add-ons by 12%,” says a brand manager.
Crafting Reward Copy
Every word counts when you’re explaining why a reward is worth chasing. Keep it punchy: lead with the benefit, then note the spend requirement.
“Ignite excitement by saying, ‘Unlock a free tote bag at $60’ instead of a bland ‘Free gift available.’” That little twist flips the script from pushy to playful.
Follow these guidelines:
Emphasize the reward’s value
Bold the spend amount for instant clarity
Inject enthusiasm or exclusivity
This approach turns thresholds into fun challenges, not hard sells—and it builds the habit that drives higher CLV.
Automating Offers With Monster Cart
Monster Cart handles thresholds, inventory checks, and timing in the background. As soon as someone knocks on that next reward door, the cart reflects it instantly—no page reloads needed.
You might be interested in our guide on offering free gifts with purchase to see exact configurations and best practices: Check out our guide on free gifts with purchase.
Key features include:
Real-time progress tracking without page reloads
Personalized gift suggestions based on cart contents
Automated tier sequencing to protect margins
This system also feeds into your analytics, so you can tweak thresholds without writing a single line of code.
Timing Upsell Modals
Drop an upsell too soon and it feels like a roadside billboard. Too late, and you miss the moment. Embedding your offer directly in the cart drawer keeps things smooth.
Try these timing hacks:
Launch the modal once the final item lands in the cart
Wait until the cart slides open before showing the offer
Use subtle animations so the message feels natural
In one experiment, delaying the slide-out by just one second boosted add-on clicks by 7%.
“Cart-based modals felt native, not annoying,” notes a DTC ecommerce director.
Balancing Discounts And Rewards
Shave margins with a blanket 20% off, or build them up with tiered gifts? Rewards win when you want happy customers without eroded profits.
Approach | AOV Impact | Margin Effect | Customer Perception |
|---|---|---|---|
20% Off Code | -5% | Lower | Expected during sales |
Free Gift at $80 | +14% | Neutral | Surprise and delight |
Free Shipping at $75 | +8% | Low | Standard reward |
These milestone incentives naturally drive spend without the usual discount drag on your margins—and they prime customers for loyalty, lifting CLV over time.
Tracking And Iteration
Data is your best friend here. Use Monster Cart’s dashboards to watch:
Cart-to-conversion rates for each tier
Gift claim rates and stock levels
Return visits linked to reward campaigns
Spot where shoppers drop off and adjust your tiers. Then run A/B tests to see which offers resonate most.
Conclusion And Next Steps
Rolling out in-cart rewards can sustainably lift conversion rates and AOV. Review your thresholds and modal timings on a regular cadence. Adapt your strategy based on real shopper behavior—and watch those numbers climb as CLV grows.
Running Effective CRO Experiments And A B Tests
Data-driven testing is what separates good Shopify stores from exceptional ones. When you start with a clear hypothesis and pick the right metrics, every A/B split becomes a learning opportunity. Integrate reward triggers (free gift vs discount) into your test matrix to see which approach lifts AOV most efficiently.
Setting Clear Hypotheses
Before you launch any test, write down exactly what you expect to change and why. This keeps your team aligned and your experiments honest.
Hypothesis title and date
Variant details (for example: “Claim Free Gift Now” vs “Get 10% Off”)
Target metric (such as add-to-cart rate or AOV lift)
Predicted lift (for example: +10%)
Prioritizing Experiments
When ideas outnumber resources, an impact-vs-effort matrix becomes your best friend. Map every test to see which ones deliver quick wins and which require more investment.
Experiment | Impact | Effort | Priority |
|---|---|---|---|
CTA: “Claim Free Gift Now” | High (+21%) | Low | 1 |
Switch “Free Shipping at $75” CTA | Medium (+12%) | Low | 2 |
Checkout Copy Segmentation | Medium (+8%) | Medium | 3 |
Layout Variation | Medium (+5%) | Low | 4 |
In one recent trial, we swapped a generic button for “Claim Free Gift Now” and watched add-to-cart conversions jump by 21%. Another split, highlighting free-shipping progress, added 12% more.
Calculating Statistical Significance
You’ll avoid chasing false positives if you know when results are solid. A quick rule of thumb is:
z = (p1 – p2) / √[ p*(1 – p) * (1/n1 + 1/n2) ]
Here, p1 and p2 are the conversion rates of each variant, p is the pooled rate, and n1/n2 represent the number of visitors in each group.
Key sample-size pointers:
Aim for at least 1,000 visitors per variant
Bigger samples trim down uncertainty
Use online calculators to nail the exact threshold
“Segmented tests in Monster Cart gave us a clear view of customer behavior,” says a Shopify growth lead.
Running Tests In Monster Cart
Monster Cart’s A/B engine handles traffic splits and tracking without extra scripts. You can set reward variants to appear as soon as the cart slides open, no manual toggling required.
Key features include:
Real-time variant tracking in the dashboard
Automated sample allocation and balancing
Custom KPI definitions for each test
Exportable reports for stakeholder reviews
We weave these findings into weekly optimization sprints, constantly refreshing our data. If you want deeper playbooks and ready-to-use KPI dashboards, check out our Revenue Optimization Course.
Continual testing builds evidence over time and powers compounding gains—both in conversion rate and AOV.
Integrating Results Into Optimization Cycles
Sharing wins and lessons keeps the team motivated and aligned.
Record winning variants and set new baselines
Archive underperforming tests to avoid repeats
Feed insights into your next hypothesis pipeline
Adjust Monster Cart reward settings based on hard data
Weekly or biweekly syncs with marketing and product ensure everyone moves in lockstep.
Sample Hypothesis Tracking Template
Use a simple spreadsheet or task board to document each experiment phase:
Hypothesis | Variant A | Variant B | Metric | Result | Next Steps |
|---|
This skeleton table safeguards against missed details and drives accountability.
Tips For Smoother Tests
Isolate a single variable per experiment to see exactly what drives change
Run tests for at least seven days to smooth out traffic spikes and lulls
Watch for holidays or promotions—those can skew your numbers
Pause tests immediately if you spot a revenue drop that threatens targets
Small, disciplined tests over time compound into big gains.
Every experiment you run adds to your store’s institutional knowledge and steadily lifts your conversion rate and AOV.
Next Steps For CRO Mastery
Once you’ve built a healthy test backlog, carve out quarterly reviews. Identify top performers, rotate your best CTAs and gift tiers, and retire tired messages.
Rotate high-impact CTAs and reward types to avoid banner blindness
Refresh segment-based copy so it stays relevant
Layer multivariate tests when sample sizes allow for deeper insights
Plot cumulative lifts month over month in a simple line graph—nothing beats a visual proof of progress for rallying the team.
Optimizing Site Speed And Mobile Experience
Nothing kills momentum like a sluggish site. In one real-world test, shaving just 500 ms off page load times delivered a 7% conversion lift for a mid-sized retailer. That jump alone makes chasing every millisecond worthwhile, especially when your reward tiers (free gift, free shipping) depend on quick cart interactions.
Reducing server response times, compressing assets and deferring non-critical scripts speeds up every click. Lazy-loading images and inlining critical CSS mean the page looks finished before it really is.
Implementing a PWA (Progressive Web App) lets shoppers browse and checkout offline, offering near-instant page returns. You’ll also see benefits by upgrading to HTTP/2 and enabling Brotli compression to shrink file sizes further.
Image Compression: Use TinyPNG to cut asset weight without visual sacrifice.
Inline Critical CSS: Prioritize above-the-fold styles to avoid render blocking.
Lazy Loading: Defer below-the-fold images for faster first paints.
PWA Integration: Add a service worker to cache key assets and deliver an app-like feel.
Performance Audit Checklist
Every optimization starts with a thorough audit. Here’s how to catch hidden slowdowns:
Lighthouse Score: Shoot for 90+ on mobile and desktop (Lighthouse Docs).
GTmetrix Analysis: Track TTFB (Time To First Byte) and fully loaded times.
Mobile Emulation: Test touch response and layout shifts on real devices.
Above-The-Fold Audit: Confirm the hero image, headline and call to action load first.
Third-Party Scripts: Pinpoint heavy libraries (like jQuery) and defer their execution.
Font Loading: Preload critical fonts and apply
font-display: swapto avoid invisible text.
Use Monster Cart’s lightweight scripts for in-cart gamification without dragging down your theme. That way, free-gift tiers and spend-to-unlock milestones pop up instantly—no page reload required.
Prioritize Above-The-Fold And Touch Targets
Mobile shoppers make split-second decisions. Prioritize hero banners, promotional offers and call-to-action buttons in your loading sequence.
When targets go live quickly, accidental taps drop dramatically. Keep interactive elements at least 48 px square and add 32 px of padding around them.
Touch Target Guidelines:
48 px minimum size for buttons and links
32 px padding around interactive zones
Avoid placing CTAs too close to screen edges
Ensure strong contrast between CTA and background
“A fluid mobile design with clear tap targets boosted our add-to-cart rate by 15%,” notes a Shopify growth lead.
Monitor Performance Metrics
Data never lies. Track First Contentful Paint, Largest Contentful Paint and Time to Interactive in real time. Set up alerts in Google Analytics or your favorite monitoring tool.
Review monthly reports, then refine layouts, deferrals and compression settings based on what you see. A global CDN can shave off another 50% of latency for international visitors.
Finally, cache API responses for dynamic widgets and revisit your mobile layouts as new devices emerge. Consistent audits and tweaks turn milliseconds saved into higher average order values—without slashing prices.
Using Trust Signals And Analytics For Insights
Trust drives online purchases. When shoppers feel confident, they’re far more likely to click “buy.” Adding clear trust cues around your cart and checkout page can ease hesitations and boost conversions—no deep discounts needed.
Display SSL badges, secure payment icons and third-party endorsements right at checkout. Real-time review widgets keep social proof fresh. And a timely post-purchase guarantee popup can calm last-second jitters and nip cart abandonment in the bud.
Position trust badges next to your primary CTA with a label like Secure Checkout.
Integrate review apps (Yotpo, Loox) to stream live star ratings inside the slide-out cart.
Analyzing Customer Behavior With Heatmaps
Heatmaps reveal exactly where visitors click, scroll and hover on product and cart pages. You’ll spot distracting elements, dead zones and overly busy layouts at a glance. In one Shopify store, moving the free-gift prompt based on heatmap data cut cart exits by 9%.
Session recordings go deeper—replaying every tap, swipe and form entry. Watching real shopper journeys exposes confusing fields or hidden reward bars. Pair those recordings with form analytics to identify the precise input where people bail out.
Use tiered analytics tools to uncover friction:
Click Maps for hotspot visualization
Scroll Maps to gauge how far users travel down the page
Form Analysis for abandoned inputs and label issues
Setting Up Google Analytics Goals
Defining specific goals in Google Analytics turns raw data into clear insights. Create separate goals for cart events, reward milestones and completed checkouts. This lets you track which in-cart incentive—say a free-gift unlock or free-shipping threshold—drives the highest average order value.
Leverage Monster Cart event integration to push unlock and tier-completion data straight into GA. With every conversion in one dashboard, you eliminate guesswork and tie reward engagement directly to revenue.
“Tracking reward unlock events in real time helped us lift AOV by 11% in one month,” reports a Shopify merchant using Monster Cart.
Building Custom Dashboards
A single dashboard that highlights conversion rate, average order value and customer lifetime value keeps your team focused. Reviewing these metrics daily or weekly replaces guesswork with hard numbers.
Metric | Definition | Target |
|---|---|---|
Conversion Rate | Purchases divided by sessions | 3.2%+ |
Average Order Value | Total revenue divided by orders | $60 |
Customer Lifetime | Projected revenue from repeat purchases | $250 |
Spotting a dip in CLV? That might be your cue to introduce a new free-gift tier. Seeing CR climb after adding trust badges confirms they’re doing their job.
Segmenting Traffic For Targeted UX Tests
Not all visitors behave the same. Organic search users often chase free-shipping thresholds, while email subscribers respond better to exclusive loyalty perks. Tailor your in-cart rewards and messaging by traffic source to boost relevance.
Organic social referral: show a free gift at $75 milestone
Paid search traffic: highlight progress toward free shipping at $50
Aligning offers to each channel’s mindset drives higher conversion and keeps customers engaged for the long haul.
Translating Data Into Action
Data alone won’t move the needle—your optimizations will. Schedule monthly sessions to review analytics, heatmaps and session recordings. Identify friction points and turn them into experiments.
List the top three form fields with the highest abandonment rate
Note heatmap areas with low clicks and redesign those sections
Rotate trust badges or tweak guarantee copy based on recent tests
Then circle back weekly to measure impact and keep your conversion rate and AOV climbing.
Common Questions About Shopify Conversion Rates
A solid desktop conversion rate sits between 2.5–3.0%, while mobile typically ranges from 1.2–1.8%. If you’re running an apparel or health shop, you might even see 3.2%+ across devices. Smaller niches—home goods or handmade crafts—often hover nearer 1.8%, so set realistic targets for your market.
Desktop Benchmark: 2.5–3.0%
Mobile Benchmark: 1.2–1.8%
Top 20% Stores: 3.2%+ overall
Adjusting Targets By Traffic And Vertical
Different channels behave in their own ways. Organic search visitors usually convert less than paid users, while email subscribers and direct traffic can hit 3.5–4.0%.
For instance, a skincare brand might aim for 3.8% conversions on newsletters but settle on 2.6% for SEO-driven visits.
“Segment targets by channel to see which tactics really move the needle,” suggests a Shopify growth lead.
Choosing In-Cart Reward Thresholds
Boosting average order value (AOV) doesn’t always mean slashing prices. Start by setting your first free-gift tier about 20–25% above your current AOV. Then layer in free-shipping milestones in $10–15 increments above those gift thresholds. This nudges shoppers to add one more item instead of waiting for a blanket sale.
Calculate your current AOV
Add 20–25% to determine the free-gift trigger
Increase the shipping threshold in steps
Monitor profit margins and tweak as needed
Monster Cart Features Driving AOV Growth
Monster Cart combines engagement and upsells without hurting margins:
Spin-to-win popups that grab attention before checkout
Tiered gift progress bars keeping customers motivated
A real-time upsell engine inside the slide-out cart
These work together to lift lifetime value, not just one-off sales.
Sustaining Conversion Gains
The key to long-term growth is relentless testing and sharp analytics. Heatmaps and session recordings reveal tiny snags you’d never spot otherwise.
Loyalty perks—like exclusive in-cart coupons for repeat shoppers—lock in higher customer lifetime value. You end up offering fewer broad discounts and building true engagement.
Run weekly experiments on CTAs, microcopy, and in-cart offers
Track conversion rate, AOV, and CLTV in custom dashboards
Rotate reward types to keep the experience fresh
“Building a loyalty layer into the cart helped us avoid constant discount cycles and boosted repeat purchases by 9%,” notes a DTC director.
Ready to turn your cart into a conversion machine? Check out Monster Cart.
Join 7000+ brands using our apps


